
-
Pl
chevron_right
vixalien: Project Final Report: Adding Debug Adapter Protocol Support to GJS
news.movim.eu / PlanetGnome • 0:00 • 12 minutes
Hello again! A few weeks ago, I wrote about the work I've been doing this summer adding Debug Adapter Protocol (DAP) support to GJS as part of Google Summer of Code (GSoC) 2026. If you haven't read that post, start there for the background on what GJS and DAP are and why this matters.
As my GSoC is wrapping up, I wanted to share you an update on what I've done, what I've learnt, and what I'm planning for the future.
Instead of a lengthy report, I actually want to walk you through debugging a real GJS application using the DAP support I've added to GJS.
By the end of this post, you'll know how to launch a GJS app in Zed, set breakpoints (including on exceptions), step through code, inspect variables and more, all from inside your editor.
Setting Up
The code I've implemented is currently in a Merge Request being reviewed , so to you use it, you will need to clone and build GJS from source (until GNOME 52).
Cloning and Building GJS from source
You can build GJS from source by following the Hacking guide , but here's a shorter version of it
# 1. Clone GJS
git clone https://gitlab.gnome.org/GNOME/gjs.git
cd gjs

# 2. Checkout my branch
git checkout wip/vixalien/dap

# 3. Setup meson
meson setup _build

# 4. Build GJS
ninja -C _build

# 5. Verify
meson devenv -C _build gjs-console ../script.js
This will be required before GNOME 52.
Please note the path where you cloned GJS (e.g.
~/Projects/gjs). We will need it later.
Editor setup
You will also need to download and install the Zed editor . The currently supported editors for GJS DAP are Zed and VS Code. We will use the Zed editor since it's more validated to work with the GJS DAP support currently.
You will also need to install the GJS Debugger Extension for Zed , which is currently pending review to be included in the Zed extension store .
But you can build it locally, by cloning
my Extension
. To install within Zed, Press
Ctrl+Shift+X
, then click "Install Dev Extension". A file picker will open, so navigate to the directory where you cloned the extension and select it.
This will require a Rust toolchain to be installed, so the extension can be built.
Let me know if you want to debug GJS apps from other editors (not just Zed).
Navigating Around
To make this concrete, I'm going to walk through debugging an standard example application.
1. Setting up the application
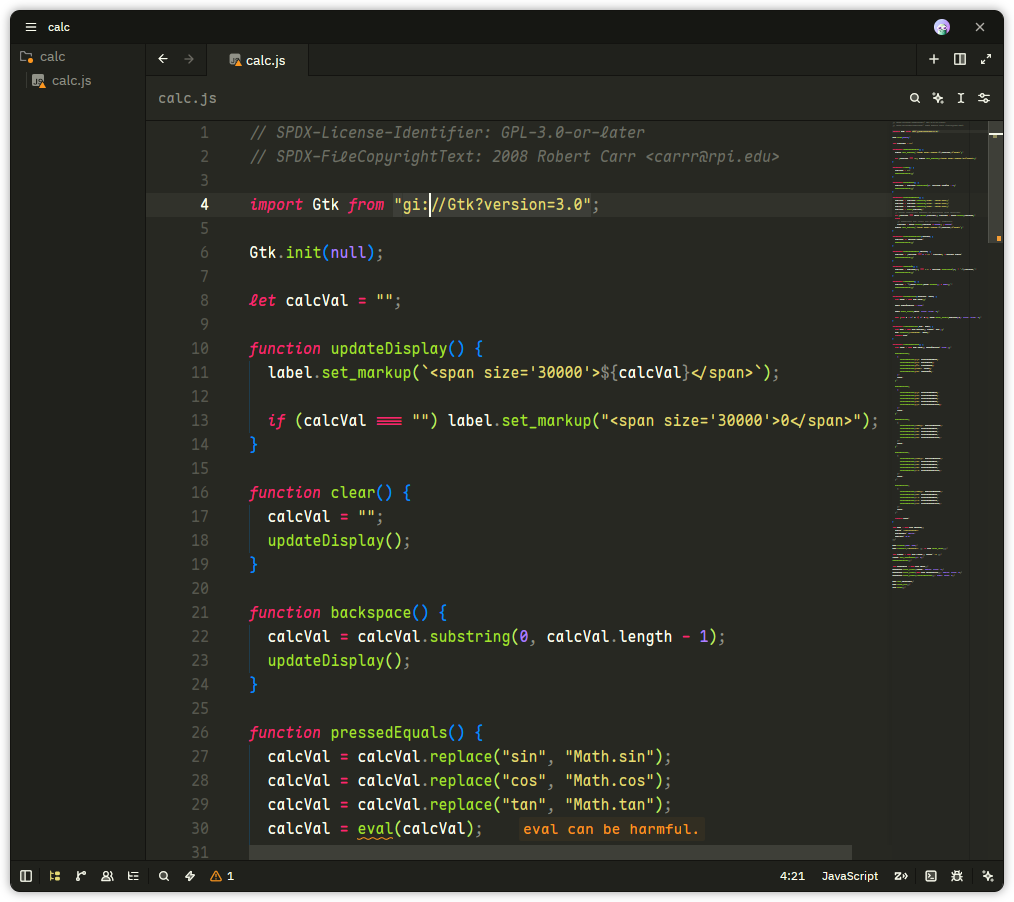
The application we are going to debug is a simple Calculator, as found in the GJS Examples
Create a simple file called
calc.js
in a new project directory and save the contents of the Calculator app above into it.
Then open the project in Zed as you normally would.
2. Opening the Project in the Debugger
To open the project in the Debugger, you can use the
F4
key to start debugging.
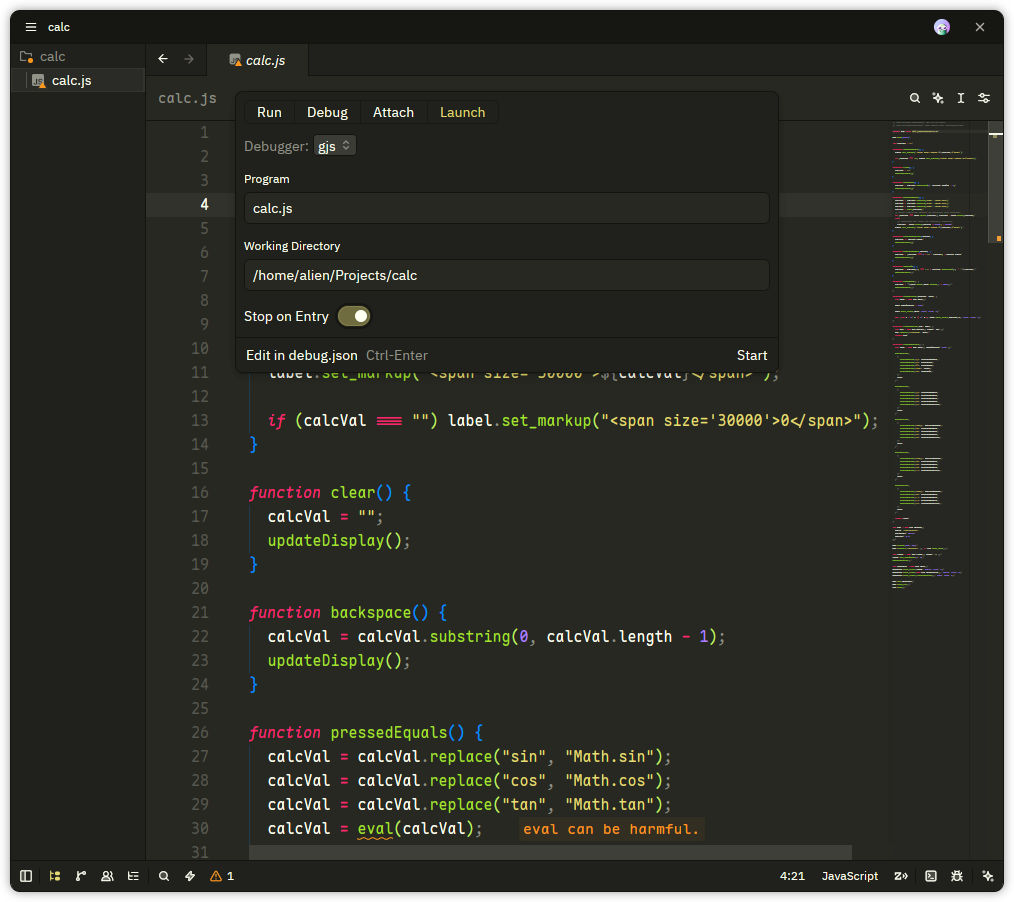
A dialog will then pop up asking for the Debugger configuration.
-
Select the
Launchtab to launch a new debugger instance. -
Select
GJSas the debugger. -
Type
calc.jsas the program to debug. - Disable "Stop On Entry" so that the debugger doesn't stop at the first line of the script.
-
Press
Ctrl+Enteror select "Edit in debug.json" to open the configuration file.
This will create a new configuration file at
.zed/debug.json
in the project directory, we will use this file to configure the debugger and make sure our debugger settings are saved across sessions.
That file will look like this:
// Project-local debug tasks
//
// For more documentation on how to configure debug tasks,
// see: https://zed.dev/docs/debugger
[
  {
    "adapter": "gjs",
    "label": "calc.js (gjs)",
    "args": [],
    "cwd": "/home/alien/Projects/calc",
    "program": "calc.js",
    "stopOnEntry": false,
  },
]
We will need to make a small modification to it to point it to the GJS we just compiled (otherwise it will use the default GJS from our system, which doesn't have the unmerged DAP changes).
This is needed before GNOME 52 is released (which means gjs will be able to do this natively).
We will do it by adding a
gjsPath
field to the configuration in this format:
...
     "program": "calc.js",
     "stopOnEntry": false,
+    "gjsPath": "flatpak-spawn --host meson devenv -C ~/Projects/gjs  --workdir . gjs-console",
   },
 ]
Where
~/Projects/gjs
is the path to the GJS repository you cloned.
After making this change, press
F5
again, and now you will see an option called
calc.js (gjs)
in the dialog's "Debug" tab.
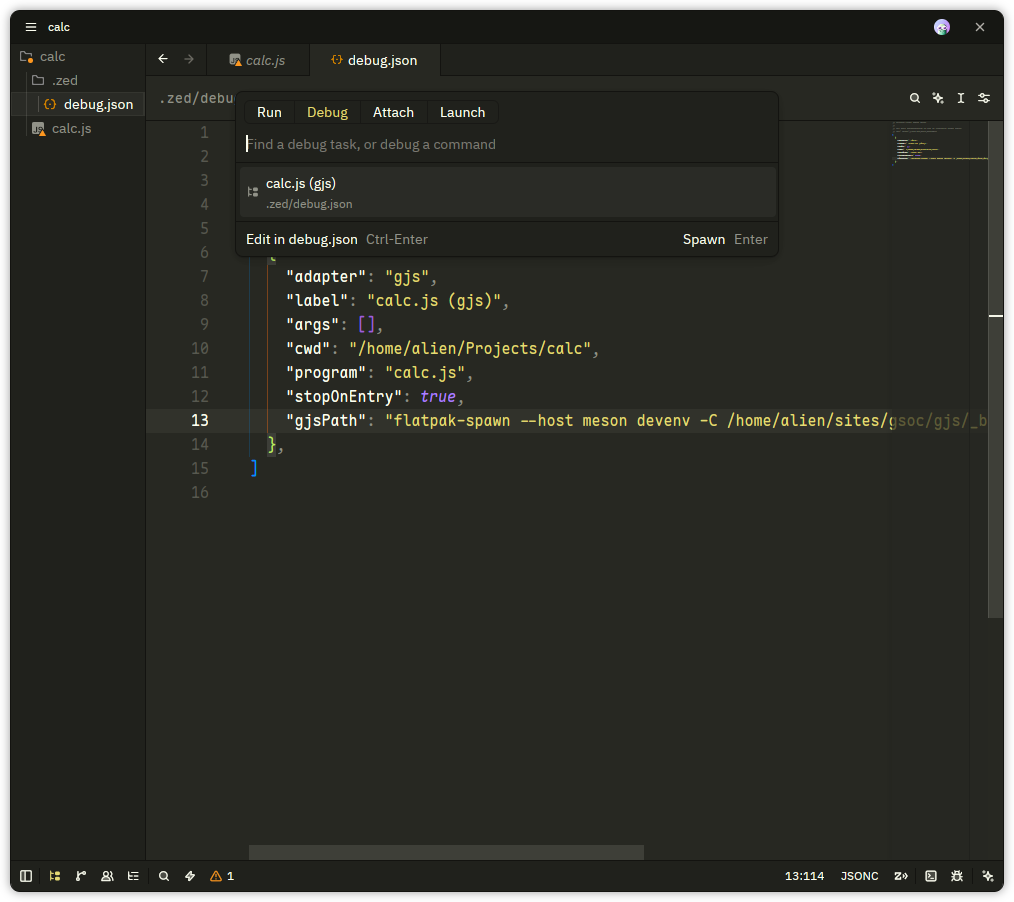
Click that configuration, and this will launch the debug configuration we just saved.
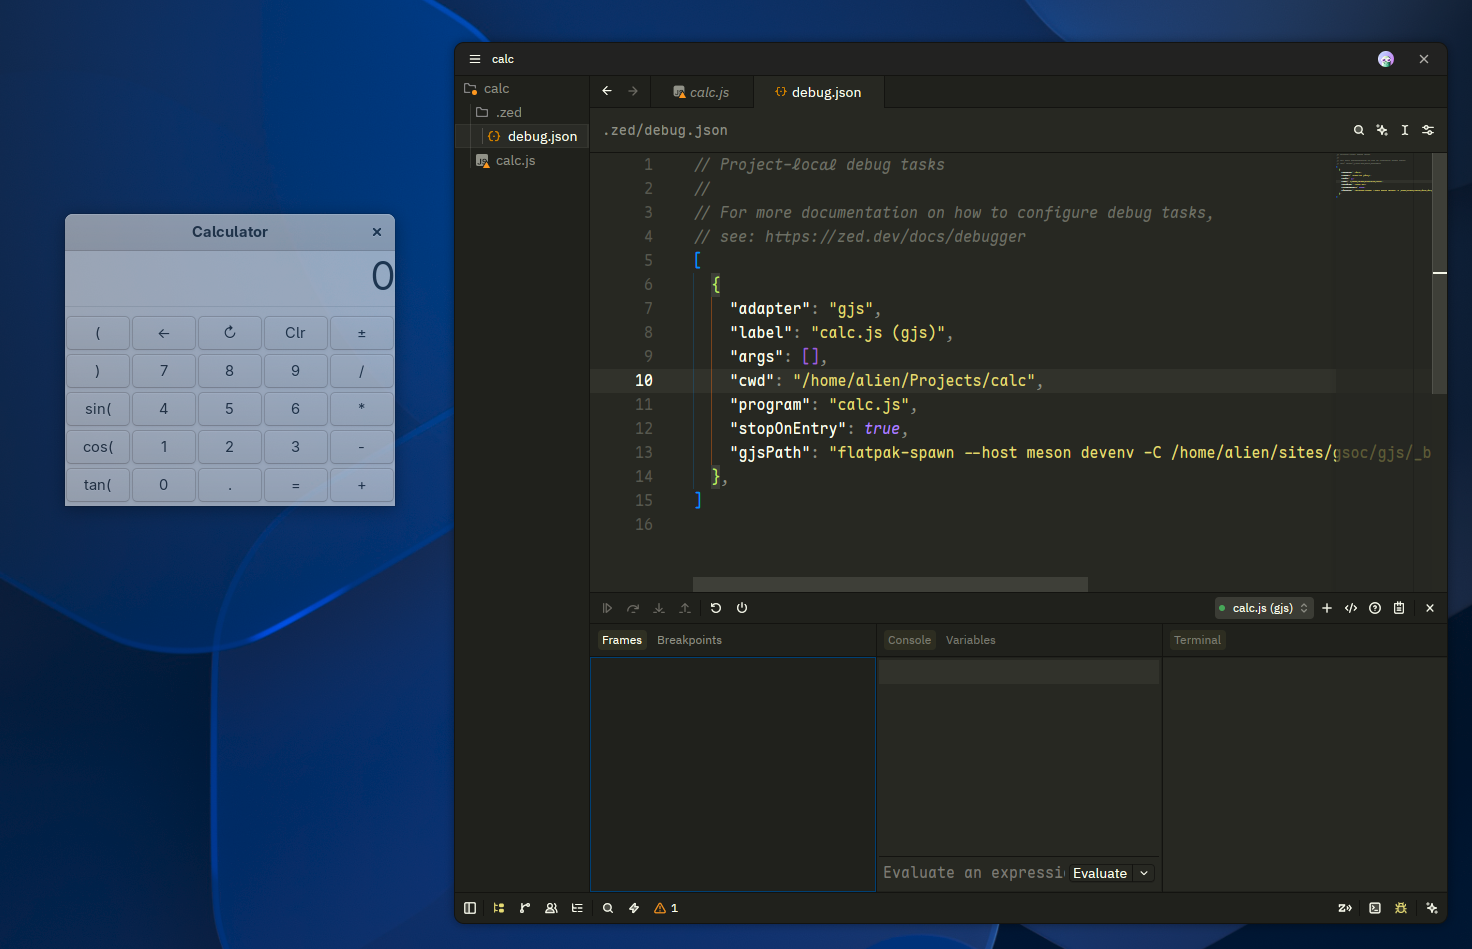
Now you have a running GJS debugger session!
3. Navigating the Debugger
At the bottom of the window, you will see a debug toolbar with various sections, panes and controls.
Fret not! The debugger toolbar is simple to understand, as I will explain here below.
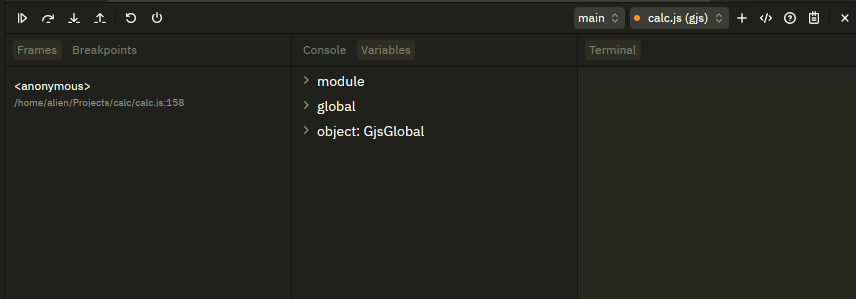
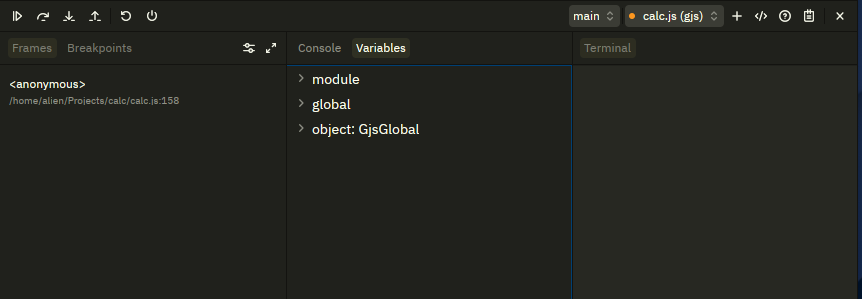
The debugger toolbar is made up of controls at the top, then 3 horizontal panes.
1. The controls bar
This is where you have different buttons to control the state of the program. In order, we have the Pause/Resume button, Step Over (or Next) button, Step In, Step Out, then the Restart and Quit buttons.

2. The frames pane
This pane shows the currently active stack frames (or call stacks).
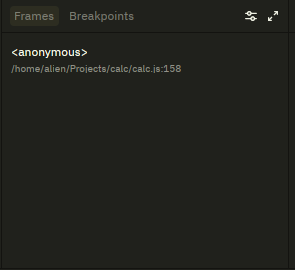
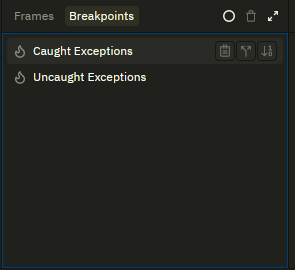
This frame has another tab that shows the various set breakpoints.
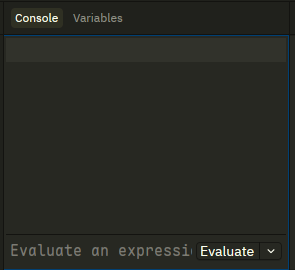
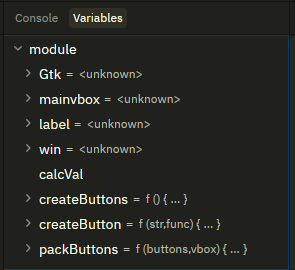
3. The console pane
This pane shows the console output of the program and allows you to potentially execute commands (not yet supported in the GJS debugger).
It has a different tab that shows the different scopes . Here, you can expand a scope to see variables inside that scope.
4. The terminal pane
Last, but not least, the terminal pane shows regular terminal output from the running program. This is also not currently implemented in the GJS debugger.
Debugging
Now that you can navigate around the debugger, let's get to debugging!
1. Using the
debugger
statement.
The
debugger
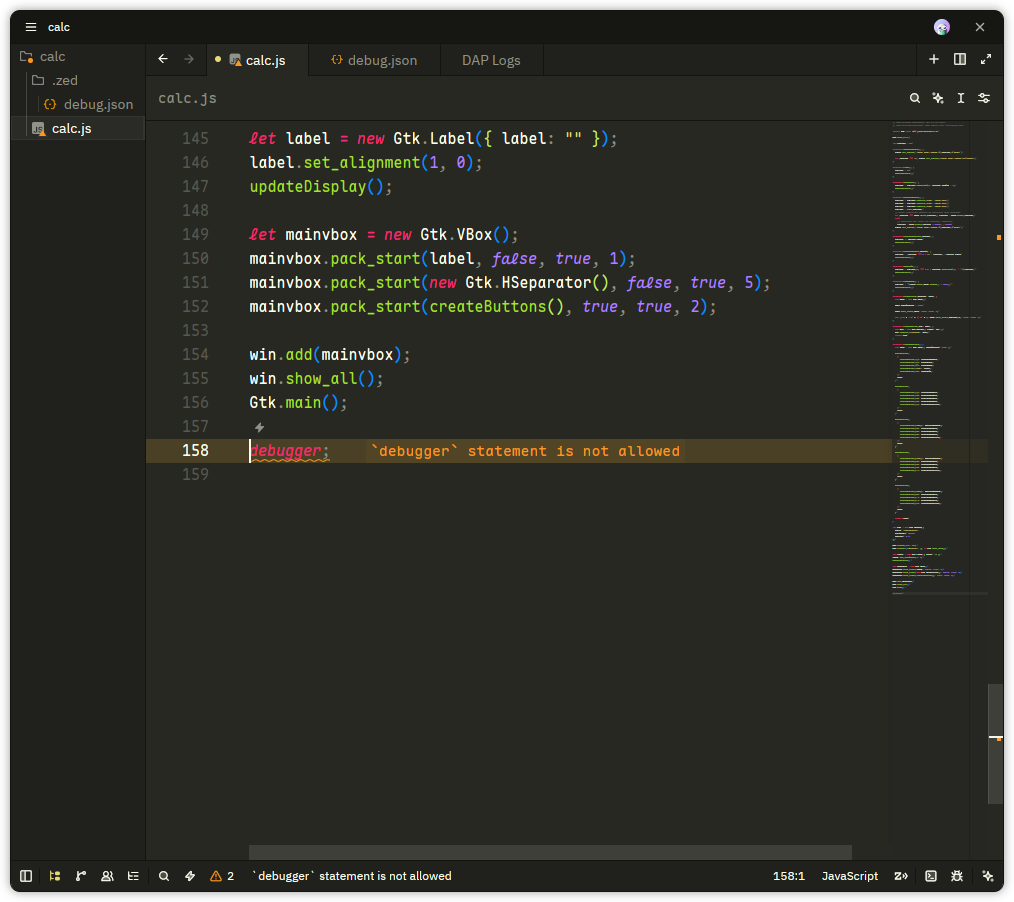
statement is a built-in statement in JavaScript that pauses execution and allows you to inspect the current state of the program at the time it pauses.
You can add a
debugger
statement to
calc.js
at the end of the file to test it out.
Then click
F5
again to start debugging. This will launch the debugger and pause execution at the
debugger
statement.
Note: Ignore the "the
debuggerstatement is not allowed" message for now, but remember to remove it before building/shipping your application.
The highlighted line is where the debugger paused execution.
2. Inspecting Variables
With the debugger now paused, you can inspect the variables in the current scope.
Click on a scope's name to expand the variables under it.
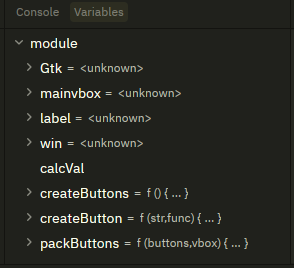
You can click on one of the objects to inspect its properties, for example, in the
module
scope, click on
Gtk
to see all the widgets available in the GTK library.
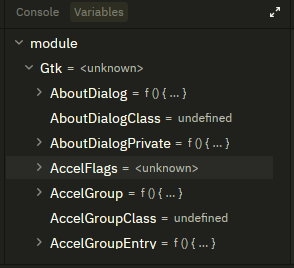
Inspecting all types of variables is implemented and you can inspect numbers, booleans, strings, symbols, functions, classes and most other types of objects.
3. Adding breakpoints
Adding the
debugger
statement is not the only way you can stop execution, you can also quite easily add breakpoints by clicking on the line number you want to pause at in the editor.
For example, let's add a breakpoint on the first line of the
pressedEquals
function.
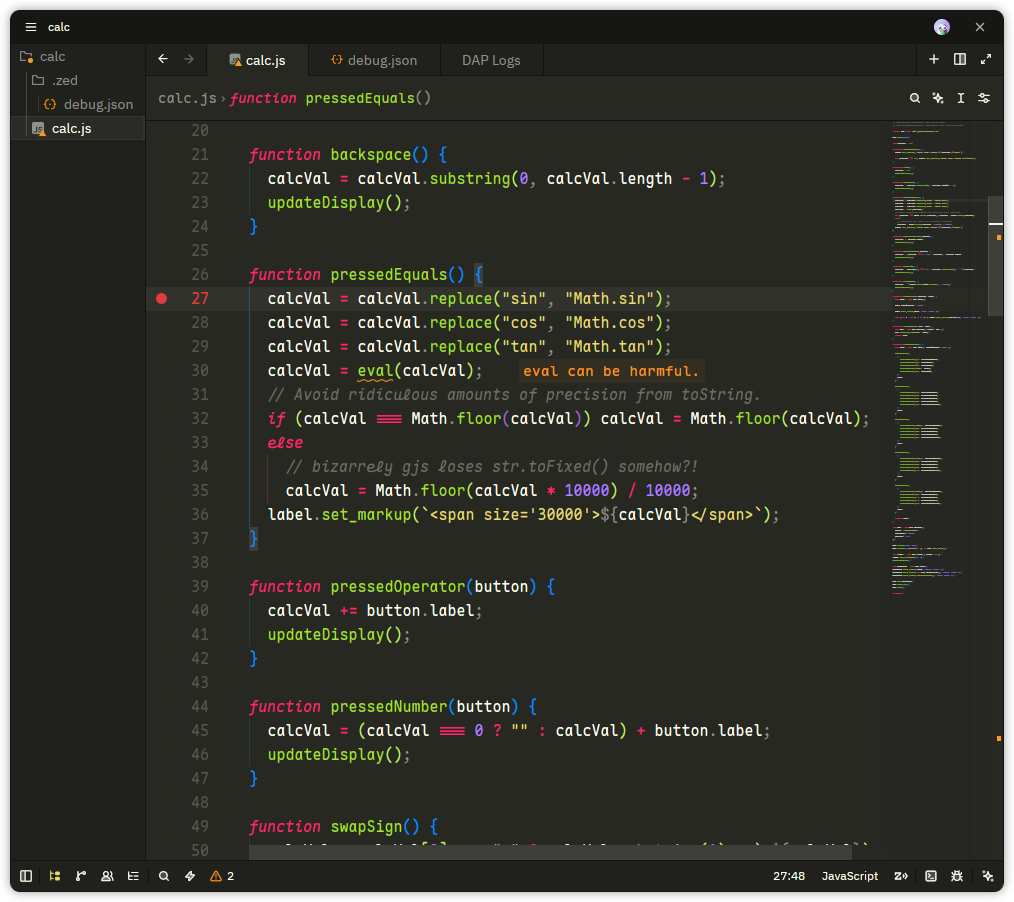
Then we can stop and restart the debugger. In the running program, type a simple equation like
1+1
, then click
=
.
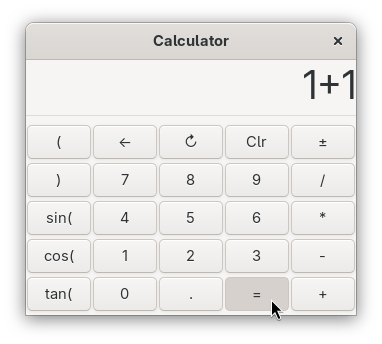
The debugger panel will now show that you're paused, and allow you to view the stack frames as well as the scopes.
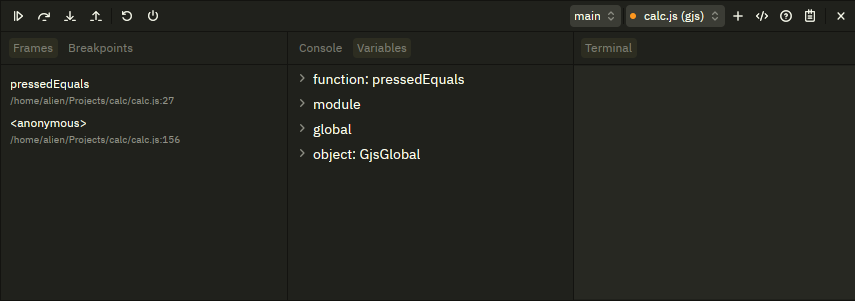
With this approach, you can debug applications and pause execution at any point to inspect the state of the program.
Also note that the breakpoints tab is now updated to show the breakpoint we just set.
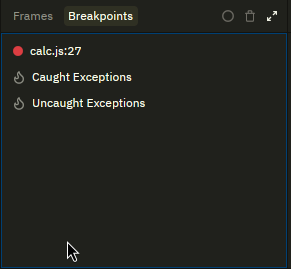
Note: The main Calculator window might now appear as Frozen (e.g. with a "« gjs-console » is not responding" message). Don't worry, this is because the program is paused in the debugger.
Note2: You can set/remove breakpoints anytime the app is running or before it starts.
4. Stepping through the code
With the application now paused, we can progressively move execution line-by-line by stepping through the code.
To "Step Over" (execute the current line and move to the next one), press the "Step Over" button in the debugger toolbar.
<video src="/images/posts/gjs-dap-report/equals-stepping.webm" loop muted autoplay controls></video>
You can also click the "Step Into" button to step into a function call (or just step over).
Here's an example where I've added a breakpoint on Line 40 (first line of
pressedOperator
button) and stepping into the
updateDisplay
function call.
<video src="/images/posts/gjs-dap-report/step-into.webm" loop muted autoplay controls></video>
Stepping back is currently not implemented.
5. Breaking on Exceptions
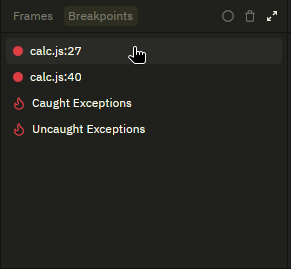
Another way to pause execution is to set to break on exceptions. The GJS debugger supports breaking on breakpoints that would either be caught (i.e. in a try {} catch {} block) or not caught (i.e. unhandled exceptions).
You can set these options by going to the Breakpoints tab and then clicking either the "Uncaught Exceptions" or "Caught Exceptions" button (or both).
VS Code Extension
I've also worked on a VS Code extension, which enables debugging GJS applications inside of VS Code, however it reamins highly experimental and many features are not working yet.
This is because I focused on the Zed extension and it's the one I used during development extensively, so the VS Code extension is not as well tested as the Zed one, but I am also planning to improve it and submit it to the VS Code extensions marketplace in-time for the GNOME 52 release!
You can find instructions to use the VS Code extension in it's repo . Here is an example of it debugging an application:
<video src="/images/posts/gjs-dap-report/vscode.webm" loop muted autoplay controls></video>
Challenges
While working on this project, I had a few challenges:
Firstly, I really had trouble working well because of the remote nature of GSoC, and sometimes collaborating with my mentor would get off-tracked because I tended towards working alone instead of realising my mentor was available to help me. For future participants, I would advise you to realise that your mentor is available to help you, instead of feeling like you should be 100% independent. In my experience, a mentor will usually point you to the right solution, or even help you understand topics you might otherwise get blocked on for too long.
Code-wise, the most challenging part was getting the message parsing (i.e. sending DAP messages and receiving them through stdio) to work. I tried many approaches on my own (see point 1 above) but at the end it got resolved when I decided to ask my mentor for help.
The issue was complex because we needed to have access to the standard input as a stream so we can parse the protocol's
Content-Length: {nBytes}\r\n
headers
, then read the corresponding number of bytes exactly. My first instinct was to use
Gio.DataInputStream
directly, but it didn't because it wasn't possible to load
Gio
/
GLib
imports in the main realm.
The solution was to create a few functions (
openInputStream
,
readLine
and
readBytes
) on the C++ side since it can use the Gio/GLib APIs, then expose them to the JS code that implements the DAP communication (and linking with Firefox/Spidermonkey's Debugger API).
Another challenge I had was when implementing the VS Code extension. In the beginning, I wrote a Zed extension that would expose GJS' DAP capabilities to the Zed Editor. When working on a similar extension for VS Code, I got stuck a bit because VS Code doesn't have a native way to easily show the communications happening between the DAP client (in this case VS Code) and the DAP server (GJS), while Zed had an easy way to show them.
This effectively hid a bug where Zed was sending/requesting an extra
/r/n
in the DAP requests & responses, while VS Code was not (they both implemented the standard differently). In the end, I created a wrapper script that would also log all the communications between the client and the server differently so I can diagnose that bug and fix it.
A recommendation I would give to future GSoC participants is to also track time and progress well. When working on the project, I didn't regularly check my proposal and the different activities and their timelines, so I ended up moving/reprioritising tasks towards the end of the program, which could have been avoided if I always checked the timeline to make sure I'm still on track and adjusting early.
Further Steps
There are some remaining tasks that could be done to make the GJS debugger better, and here's some of them.
- Bring the VS Code extension to feature parity as the Zed extension ( see above ).
- Add support for debugging GJS applications in GNOME Builder: Currently blocked by GNOME Builder itself lacking DAP support
- Add support for evaluating expressions in the debugger when paused.
- Correctly stop/kill the script when the debug session ends.
- Enabling source map support, which will make debugging compiled GJS (and TypeScript!) applications (like GNOME Weather, GNOME Sound Recorder) easier.
- Testing and ensuring the debugger works well on macOS and Windows (I only tested on Linux).
-
Redirect
console.logand other output to the debug console. - Allow attaching to already running GJS applications (potentially by implementing a SIGUSR1 handler and communicating via unix socket).
- Allow pausing the program that's being debugged (at any point).
- Implement setting or modifying variables in the debugger.
- Give information about the current exception when we hit an exception breakpoint (needs the VS Code extension).
- Maybe implement watching source code and live-reload of the code while debugging.
-
Implement more DAP capabilities (e.g. function breakpoints, conditional breakpoints) to improve the debugging experience even more (including correct
presentationHint) -
Show the scopes in a better way (e.g. merge the
globalandGjsGlobalscopes, potentially merge theclass bodyscopes, etc...) - Maybe support debugging the GNOME Shell??
- Maybe implement GJS debugging (and provide instructions) for other DAP clients like Emacs, Vim, etc. (see full list of tools implementing DAP here )
-
Maybe add documentation for debugging a GJS application while developing with meson (will need to add a
run_target).
Let me know if there's more support you may want, or if you'd like to work on any of these.
Improving WASM Support
As part of the GSoC project, during the initial community bonding period, I also worked on improving WASM support in GJS . The MR essentially connects WASM's event loop to the GLib main loop set up by GJS.
Conclusion
I would like to thank Google Summer of Code for selecting me to work on this project, which I hope will improve the experience of writing, debugging and improve GJS applications.
I'd also like to thank the GNOME Project for hosting GJS, which is an important part of the GNOME ecosystem.
Finally, I'd like to thank my mentor Philip Chimento so much for his important skills, guidance, and support while I was working on this project.
You can reach out in the GNOME JavaScript room in Matrix:
#javascript:gnome.org
for any questions or feedback.