Real-time messaging
sits at the centre of many modern digital products. From live chat and streaming reactions to betting platforms and collaborative tools, users expect communication to feel immediate and consistent.
When pressure builds, the system doesn’t typically collapse. It starts to drift. Messages arrive slightly late, ordering becomes inconsistent, and the platform feels less reliable. That drift is often the first signal that
chat scalability
is under strain.
Imagine a live sports final going into overtime. Millions of viewers react at once. Messages stack up, connections remain open, and activity intensifies. For a moment, everything appears stable. Then delivery slows. Reactions fall slightly out of sync. Some users refresh, unsure whether the delay is on their side or yours.
Those moments reveal whether the system was designed with
fault tolerance
in mind. If it was, the platform degrades predictably and recovers. If it wasn’t, small issues escalate quickly.
This article explores what breaks first in real-time messaging and how early architectural decisions determine whether users experience resilience or visible strain.
Real-Time Messaging in Live Products
Live products place
real-time messaging
under immediate scrutiny. On sports platforms, streaming services, online games, and live commerce sites, messaging is visible while it happens. When traffic spikes, performance issues are exposed immediately.
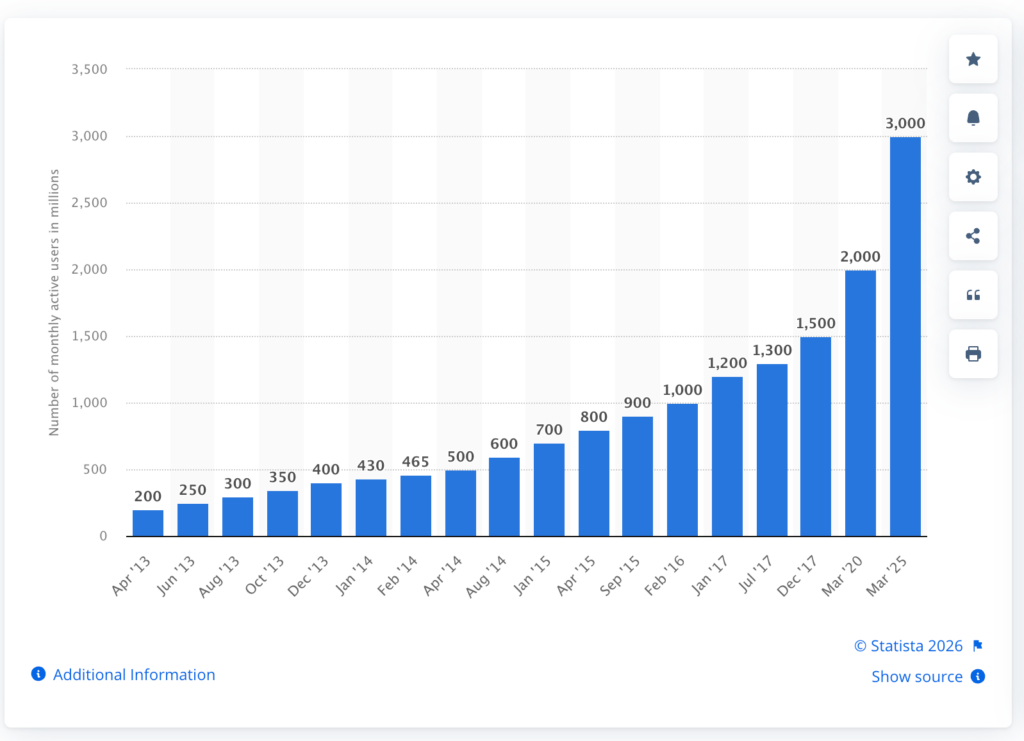
User expectations are already set. WhatsApp reports more than
2 billion monthly active users
, shaping what instant communication feels like in practice. That expectation carries into every live experience, whether it is chat, reactions, or collaborative interaction.
Source: Statista
Live environments concentrate demand rather than distribute it evenly. Traffic clusters around specific moments. Concurrency can double within minutes, and those users remain connected while message volume increases sharply. That concentration exposes limits in
chat scalability
far more quickly than steady growth ever would.
The operational impact tends to follow a familiar pattern:
|
Live scenario
|
System pressure
|
Business impact
|
|
Sports final
|
Sudden surge in concurrent users
|
Latency becomes public
|
|
Product launch
|
Burst of new sessions
|
Onboarding friction
|
|
Viral stream moment
|
Rapid fan-out across channels
|
Inconsistent experience
|
|
Regional spike
|
Localised traffic surge
|
Infrastructure imbalance
|
For live platforms, volatility comes with the territory.
When delivery slows or behaviour becomes inconsistent, engagement drops first. Retention follows. Users rarely blame infrastructure. They blame the platform.
Designing for unpredictable load requires architecture that assumes spikes are normal and isolates failure when it occurs. If you operate a live platform, that discipline determines whether users experience seamless interaction or visible strain.
High Concurrency and Chat Scalability
In live environments, real-time messaging operates under sustained concurrency rather than occasional bursts. Users remain connected, they interact continuously, and activity compounds when shared moments occur.
High concurrency is not simply about having many users online. It involves managing thousands, sometimes millions, of persistent connections sending and receiving messages at the same time. Every open connection consumes resources, and messages may need to be delivered to large groups of active participants without delay.
This is where chat scalability really gets tested.
In steady conditions, most systems appear stable. When demand synchronises, message fan-out increases rapidly, routing paths multiply, and coordination overhead grows. Small inefficiencies that were invisible during testing begin to surface. Response times drift. Ordering becomes inconsistent. Queues expand before alerts signal a problem.
High concurrency does not introduce entirely new issues. It reveals architectural assumptions that only become visible at scale. Concurrency increases are predictable in live systems. The risk lies in whether the messaging layer can sustain that pressure without affecting user experience.
Messaging Architecture Limits
The pressure created by high concurrency does not stay abstract for long. It shows up in the
messaging architecture
.
When performance degrades under load, the root cause usually sits there. At scale, every message must be routed, processed, and delivered to the correct subscribers. In distributed systems, that requires coordination across servers, and coordination carries cost. Under sustained traffic, small inefficiencies compound quickly.
Routing layers can become bottlenecks when messages must propagate across multiple nodes. Queues expand when incoming traffic outpaces processing capacity. Latency increases as backlogs grow. If state drifts between nodes, messages may arrive late or appear out of sequence.
This is where the earlier discussion of
chat scalability
becomes tangible. It is not only about supporting more users. It is about how efficiently the architecture distributes load and maintains consistency when concurrency remains elevated.
These limits rarely appear during controlled testing with predictable traffic. They emerge under real usage, where concurrency is sustained and message patterns are uneven.
Well-designed systems account for this from the outset. They reduce coordination overhead, isolate failure domains, and scale horizontally without introducing fragility. When they do not, performance drift becomes visible long before a full outage occurs, and users feel the impact immediately.
Fault Tolerance and Scaling
If you operate a live platform, this is where design choices become visible.
Once architectural limits are exposed, the question is how your system behaves as demand continues to rise.
Scaling real-time messaging is about making sure that when components falter, the impact is contained. Distributed systems are built on a simple assumption: things break. You will see restarts, reroutes and unstable network conditions. But the real test is whether your architecture absorbs the shock or amplifies it.
Systems built with fault isolation in mind tend to recover locally. Load shifts across nodes. Individual components stabilise without affecting the wider service. Systems built around central coordination points are more vulnerable to ripple effects.
In practical terms, the difference shows up as:
-
Localised disruption rather than cascading instability
-
Brief slowdown instead of prolonged degradation
-
Controlled recovery rather than platform-wide interruption
These behaviours define whether users experience resilience or instability.
Fault tolerance determines how the system behaves when conditions are at their most demanding.
Real-Time Messaging in Entertainment
Entertainment platforms expose weaknesses in real-time messaging quickly because traffic converges rather than building steadily over time.
When a live event captures attention, users respond together. Demand rises sharply within a short window, and those users remain connected while interaction increases. The stress on the system comes not from gradual growth, but from concentrated activity.
Take the widespread
Cloudflare outage in November 2025
. As a core infrastructure provider handling a significant share of global internet traffic, its disruption affected major platforms simultaneously. The issue was due to underlying infrastructure, but the impact was immediate and highly visible because so many users were active at once.
Live gaming environments operate under comparable traffic patterns by design. During competitive matches on
FACEIT
, large numbers of players remain connected while scores, rankings, and in-game events update continuously. Activity intensifies around key moments, increasing message throughput while persistent connections stay open.
Across these environments, the pattern is consistent. Users connect simultaneously, interact continuously, and expect immediate feedback. When performance begins to drift, the impact is shared rather than isolated.
A Note on Architecture
This is where architectural choices begin to matter.
Platforms that manage
sustained concurrency
and recover predictably under pressure tend to share certain structural characteristics. In messaging environments,
MongooseIM
is one example of infrastructure designed around those principles.
In practical terms, that means:
-
Supporting large numbers of persistent connections without central bottlenecks
-
Distributing load across nodes to reduce coordination overhead
-
Containing failure within defined boundaries rather than allowing it to cascade
-
Maintaining message consistency even when traffic intensifies
These design choices do not eliminate volatility. They determine how the system behaves when it does.
In live entertainment platforms, that distinction shapes whether pressure remains internal or becomes visible to users.
Conclusion
Real-time messaging raises expectations that are easy to meet under steady conditions and far harder to sustain when attention converges.
What breaks first is rarely availability. It is timing. It is the subtle drift in delivery and consistency that users notice before any dashboard signals a failure.
Live environments make that visible because traffic arrives together and interaction compounds quickly. Concurrency is not the exception. It is the operating model. Whether the experience holds depends on how the architecture distributes load and contains failure.
Designing for that reality early makes scaling more predictable and reduces the risk of visible strain later.If you are building or modernising a platform where real-time interaction matters, assess whether your messaging architecture is prepared for sustained concurrency.
Get in touch
to continue the conversation.
The post
What Breaks First in Real-Time Messaging?
appeared first on
Erlang Solutions
.


